Income needed (U.S.)
$141K
To afford the median listing of $419,250
Median household income
$82K
U.S., Census ACS 2024; 1.72× short of the income needed
States within reach
0 of 50
Where a median-income household can afford the median listing
Most affordable
Iowa
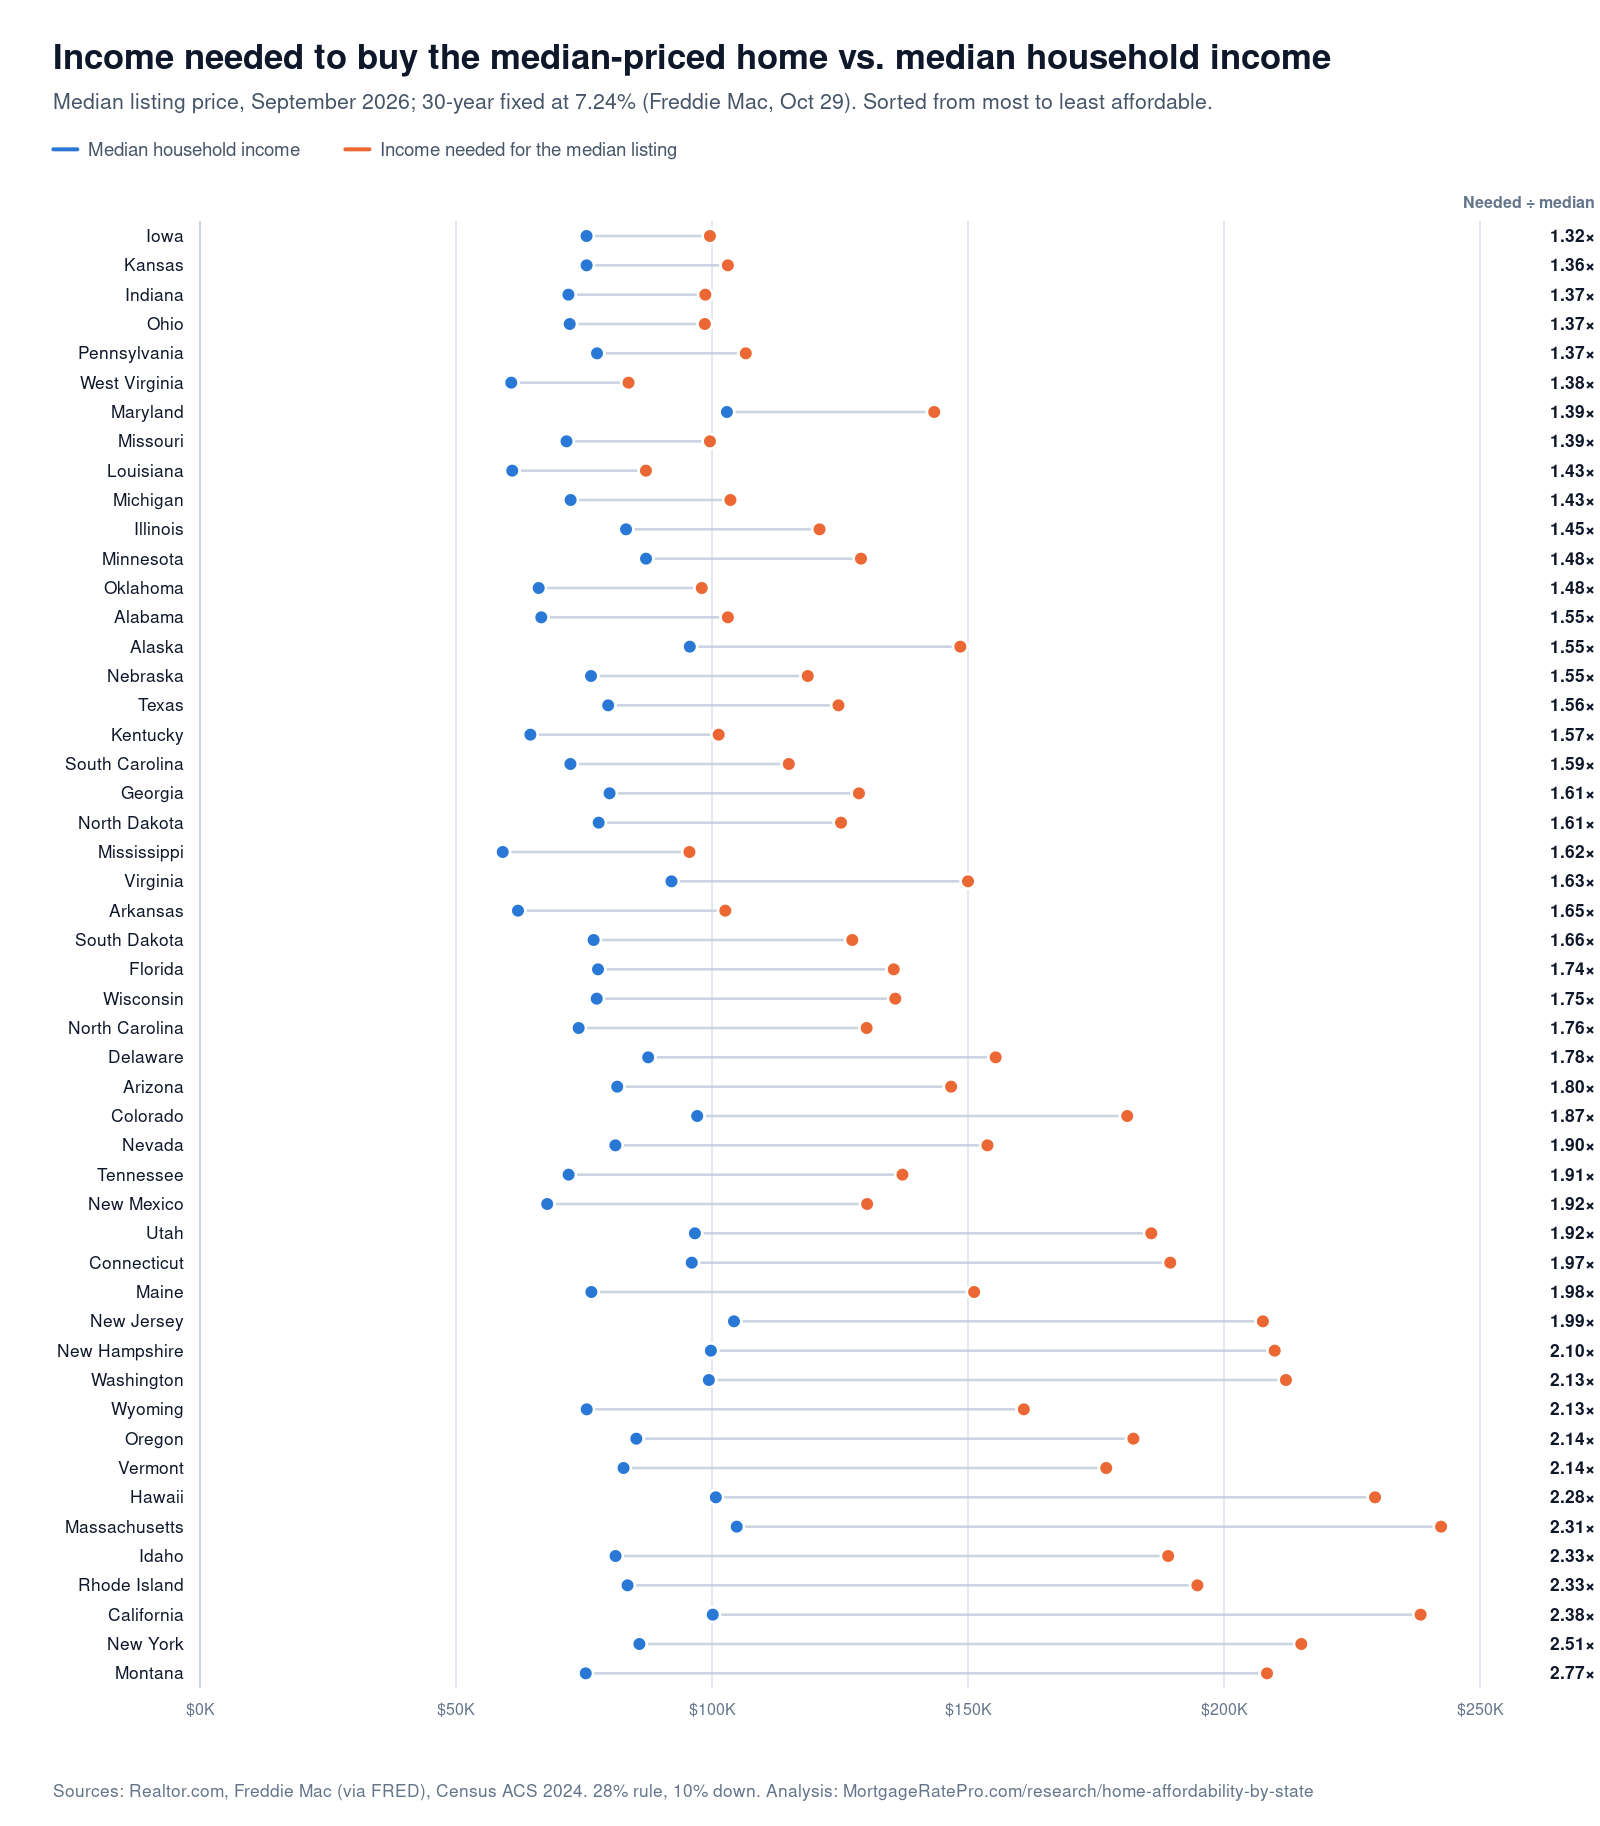
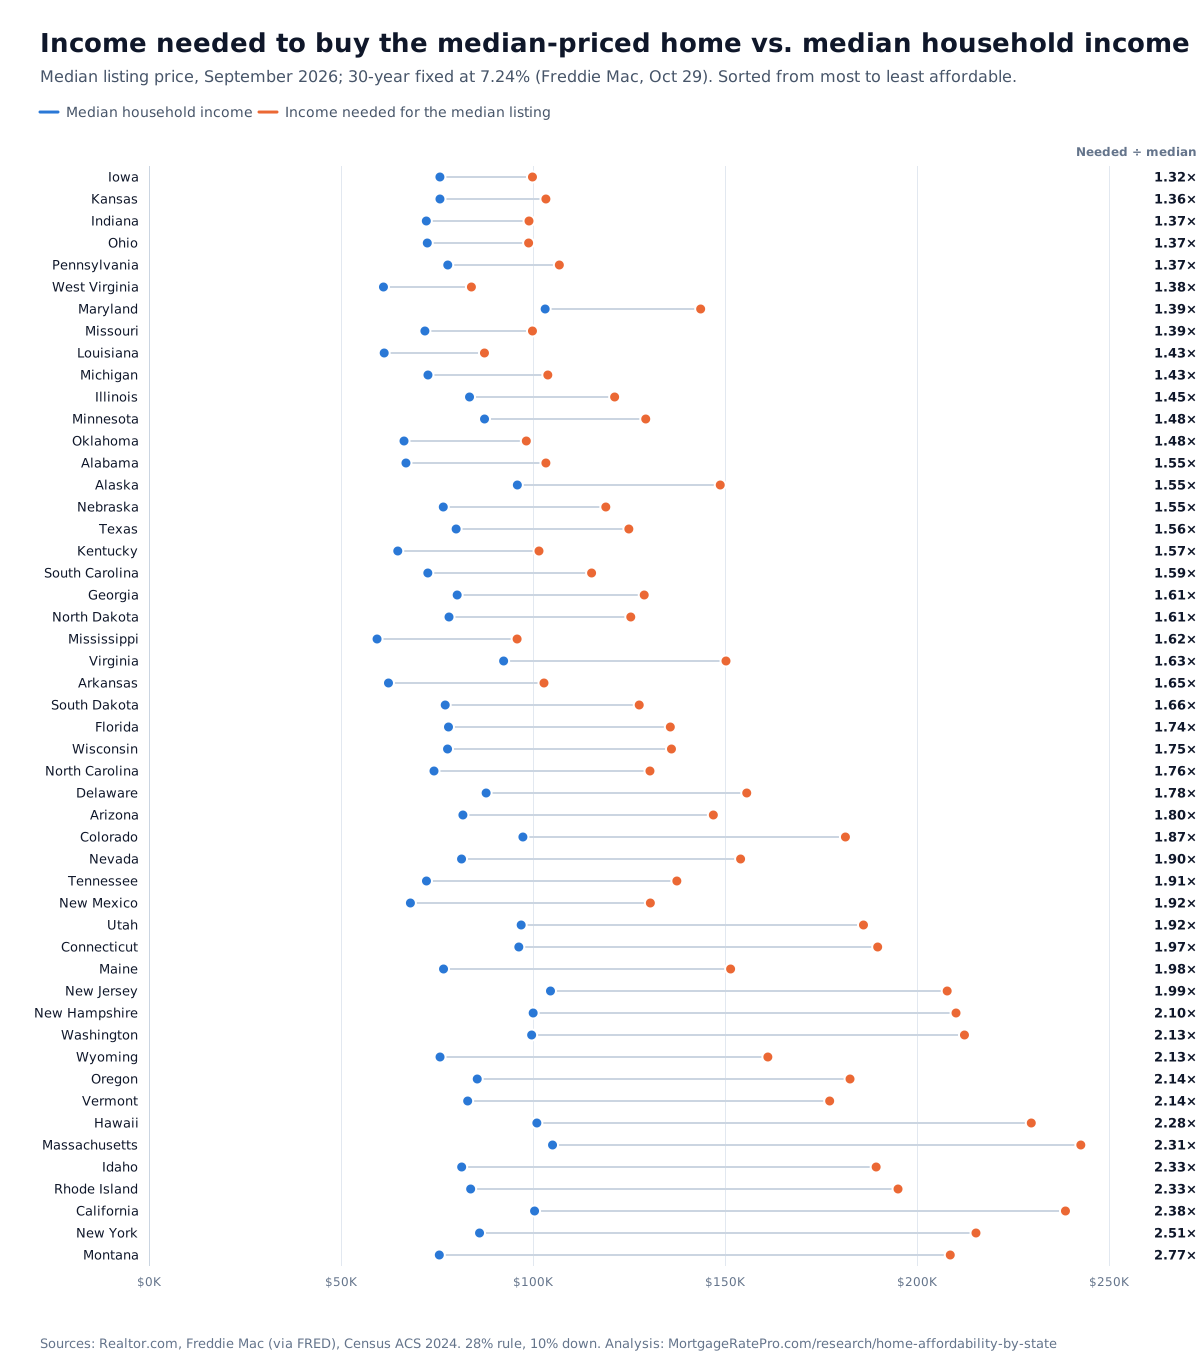
Income needed is 1.32× the median; in Montana it is 2.77×
Key findings
- The typical U.S. listing needs $141K a year. To buy the median listing ($419,250 in September 2026) with 10% down at 7.24%, housing costs of $3,281 a month have to stay within 28% of gross income. That takes about $140,600 a year, 1.72× the median household income of $81,604.
- In no state can a median-income household afford the median listing. The gap is smallest in Iowa, Kansas and Indiana, where the income needed is about 1.32× to 1.37× the median.
- 8 states need more than $200,000 a year. New Jersey, New Hampshire, Washington, Hawaii, Massachusetts, California, New York and Montana require $208K to $242K. Montana has the widest gap: the income needed is 2.77× the state's median household income.
- Rates move the bar by about $11K per point. At 6.24% the U.S. income needed would be $129,900; at 8.24%, $151,800.
- Cash is the other hurdle. A 10% down payment plus closing costs on the median U.S. listing comes to about $54,500.
Income needed vs. median income, every state
Sorted from most to least affordable. Values in thousands of dollars a year.
Full table
Click a column heading to sort.
| Rank | State | Median listing | Income needed | Median household income | Needed ÷ median | Affordable on median income | Monthly payment | Property tax rate |
|---|---|---|---|---|---|---|---|---|
| 1 | Iowa | $284,900 | $99,600 | $75,501 | 1.32× | $216,000 | $2,325 | 1.29% |
| 2 | Kansas | $296,000 | $103,100 | $75,514 | 1.36× | $217,000 | $2,405 | 1.25% |
| 3 | Indiana | $299,000 | $98,700 | $71,959 | 1.37× | $218,000 | $2,302 | 0.74% |
| 4 | Ohio | $284,000 | $98,600 | $72,212 | 1.37× | $208,000 | $2,302 | 1.22% |
| 5 | Pennsylvania | $309,000 | $106,600 | $77,545 | 1.37× | $225,000 | $2,487 | 1.16% |
| 6 | West Virginia | $259,997 | $83,700 | $60,798 | 1.38× | $189,000 | $1,953 | 0.52% |
| 7 | Maryland | $425,000 | $143,400 | $102,905 | 1.39× | $305,000 | $3,347 | 0.95% |
| 8 | Missouri | $300,000 | $99,600 | $71,589 | 1.39× | $216,000 | $2,324 | 0.79% |
| 9 | Louisiana | $270,000 | $87,100 | $60,986 | 1.43× | $189,000 | $2,032 | 0.53% |
| 10 | Michigan | $299,900 | $103,600 | $72,389 | 1.43× | $209,000 | $2,418 | 1.18% |
| 11 | Illinois | $324,950 | $121,000 | $83,211 | 1.45× | $224,000 | $2,823 | 1.92% |
| 12 | Minnesota | $379,900 | $129,100 | $87,117 | 1.48× | $256,000 | $3,013 | 1.02% |
| 13 | Oklahoma | $296,643 | $98,000 | $66,148 | 1.48× | $200,000 | $2,287 | 0.75% |
| 14 | Alabama | $325,000 | $103,100 | $66,659 | 1.55× | $210,000 | $2,405 | 0.38% |
| 15 | Alaska | $435,000 | $148,500 | $95,665 | 1.55× | $280,000 | $3,464 | 1.06% |
| 16 | Nebraska | $335,000 | $118,700 | $76,376 | 1.55× | $216,000 | $2,770 | 1.42% |
| 17 | Texas | $355,765 | $124,700 | $79,721 | 1.56× | $228,000 | $2,909 | 1.31% |
| 18 | Kentucky | $307,775 | $101,300 | $64,526 | 1.57× | $196,000 | $2,363 | 0.71% |
| 19 | South Carolina | $359,945 | $115,000 | $72,350 | 1.59× | $226,000 | $2,684 | 0.45% |
| 20 | Georgia | $389,750 | $128,700 | $79,991 | 1.61× | $242,000 | $3,002 | 0.74% |
| 21 | North Dakota | $370,700 | $125,200 | $77,871 | 1.61× | $231,000 | $2,922 | 0.96% |
| 22 | Mississippi | $292,250 | $95,600 | $59,127 | 1.62× | $181,000 | $2,230 | 0.65% |
| 23 | Virginia | $455,953 | $150,000 | $92,090 | 1.63× | $280,000 | $3,500 | 0.71% |
| 24 | Arkansas | $318,743 | $102,600 | $62,106 | 1.65× | $193,000 | $2,395 | 0.52% |
| 25 | South Dakota | $375,000 | $127,400 | $76,881 | 1.66× | $226,000 | $2,974 | 1.02% |
| 26 | Florida | $409,950 | $135,500 | $77,735 | 1.74× | $235,000 | $3,161 | 0.75% |
| 27 | Wisconsin | $389,900 | $135,800 | $77,488 | 1.75× | $223,000 | $3,168 | 1.25% |
| 28 | North Carolina | $400,000 | $130,200 | $73,958 | 1.76× | $227,000 | $3,038 | 0.61% |
| 29 | Delaware | $484,998 | $155,400 | $87,534 | 1.78× | $273,000 | $3,626 | 0.47% |
| 30 | Arizona | $459,900 | $146,700 | $81,486 | 1.80× | $256,000 | $3,422 | 0.43% |
| 31 | Colorado | $564,000 | $181,100 | $97,113 | 1.87× | $302,000 | $4,226 | 0.49% |
| 32 | Nevada | $480,000 | $153,800 | $81,134 | 1.90× | $253,000 | $3,588 | 0.47% |
| 33 | Tennessee | $429,450 | $137,200 | $71,997 | 1.91× | $225,000 | $3,202 | 0.45% |
| 34 | New Mexico | $399,475 | $130,300 | $67,816 | 1.92× | $208,000 | $3,041 | 0.63% |
| 35 | Utah | $579,000 | $185,800 | $96,658 | 1.92× | $301,000 | $4,336 | 0.49% |
| 36 | Connecticut | $522,500 | $189,500 | $96,049 | 1.97× | $265,000 | $4,422 | 1.66% |
| 37 | Maine | $450,000 | $151,200 | $76,442 | 1.98× | $228,000 | $3,528 | 0.91% |
| 38 | New Jersey | $559,500 | $207,600 | $104,294 | 1.99× | $281,000 | $4,843 | 1.89% |
| 39 | New Hampshire | $590,000 | $209,900 | $99,782 | 2.10× | $280,000 | $4,898 | 1.46% |
| 40 | Washington | $639,475 | $212,100 | $99,389 | 2.13× | $300,000 | $4,948 | 0.79% |
| 41 | Wyoming | $496,500 | $160,900 | $75,532 | 2.13× | $233,000 | $3,754 | 0.57% |
| 42 | Oregon | $550,000 | $182,300 | $85,220 | 2.14× | $257,000 | $4,255 | 0.78% |
| 43 | Vermont | $499,450 | $177,000 | $82,730 | 2.14× | $233,000 | $4,131 | 1.42% |
| 44 | Hawaii | $732,450 | $229,500 | $100,745 | 2.28× | $322,000 | $5,354 | 0.27% |
| 45 | Massachusetts | $714,250 | $242,400 | $104,828 | 2.31× | $309,000 | $5,655 | 1.00% |
| 46 | Idaho | $593,000 | $189,100 | $81,166 | 2.33× | $255,000 | $4,412 | 0.43% |
| 47 | Rhode Island | $569,900 | $194,800 | $83,504 | 2.33× | $244,000 | $4,546 | 1.07% |
| 48 | California | $725,000 | $238,400 | $100,149 | 2.38× | $305,000 | $5,563 | 0.71% |
| 49 | New York | $605,000 | $215,100 | $85,820 | 2.51× | $241,000 | $5,019 | 1.45% |
| 50 | Montana | $635,000 | $208,400 | $75,340 | 2.77× | $230,000 | $4,864 | 0.69% |
| — | United States | $419,250 | $140,600 | $81,604 | 1.72× | $243,000 | $3,281 | 0.89% |
What this means if you're buying
- The median is not your budget. Listing medians include large and luxury homes; in every state plenty of homes are listed below the median. Start from what your income supports, not from the typical price.
- Debts lower the bar further. These figures assume no car loans, student loans or card balances. Other monthly debts reduce what you can afford once they push total debt payments above 36% of income.
- Down payment help can change the math. Many states run down payment assistance for moderate-income buyers; see our guide to down payment assistance.
For your own numbers, use the home affordability calculator, or see what a specific salary buys: $60K, $80K, $100K.
Methodology
Income needed. The monthly cost of the median listing (principal and interest on a 30-year fixed loan with 10% down, property taxes, homeowners insurance at 0.6% of the price a year, and private mortgage insurance at 0.6% of the loan a year) divided by 28%, the common front-end limit lenders apply to gross income, then multiplied by 12.
Inputs. Median listing prices are Realtor.com's for September 2026. The mortgage rate is Freddie Mac's Primary Mortgage Market Survey average for the week of October 29, 2026. Median household income, median real estate taxes and median home values come from the Census Bureau's American Community Survey 2024 1-year estimates, the latest available; the property tax rate is median taxes paid divided by median home value. Because incomes are from 2024, today's incomes are likely somewhat higher.
Limits. Listing prices are not sale prices, and state medians hide large differences between cities. The calculation ignores HOA dues and other debts. It is a consistent yardstick across states, not a personal affordability verdict.
Sources.
Download, cite or embed
The figures and the chart may be republished with a credit to MortgageRatePro and a link to this page (CC BY 4.0).
- All 50 states (CSV)
- Chart: PNG · SVG
Suggested citation
MortgageRatePro, “Income Needed to Buy a Home in Every State,” September 2026 edition, https://www.mortgageratepro.com/research/home-affordability-by-state/

About this report
This report is written and maintained by Federico Miotti, founder and editor of MortgageRatePro. State-level cuts of the data are available on request.
Media inquiries: write to us through the contact form (topic: Media inquiry).