12-month CD gap
2.43 pts
1.73% average CD vs. 4.16% 1-year Treasury; up 0.06 from July
Paid per $1 of Treasury yield
42¢
Average 12-month CD rate as a share of the 1-year Treasury yield
Five-year cost on $10,000
$1,746
Less interest in the average 5-year CD than at the 5-year Treasury yield
Months below inflation
65 of 65
Average 12-month CD vs. CPI inflation, Feb 2021 – Aug 2026
Key findings
- Average CDs pay well under half the Treasury yield. The FDIC's national average for a 12-month CD was 1.73% on August 31, 2026, while the 1-year Treasury yielded 4.16%. That's a gap of 2.43 percentage points: savers earned about 42 cents for every dollar of the risk-free rate. On $10,000, that's $173 in a year instead of $416.
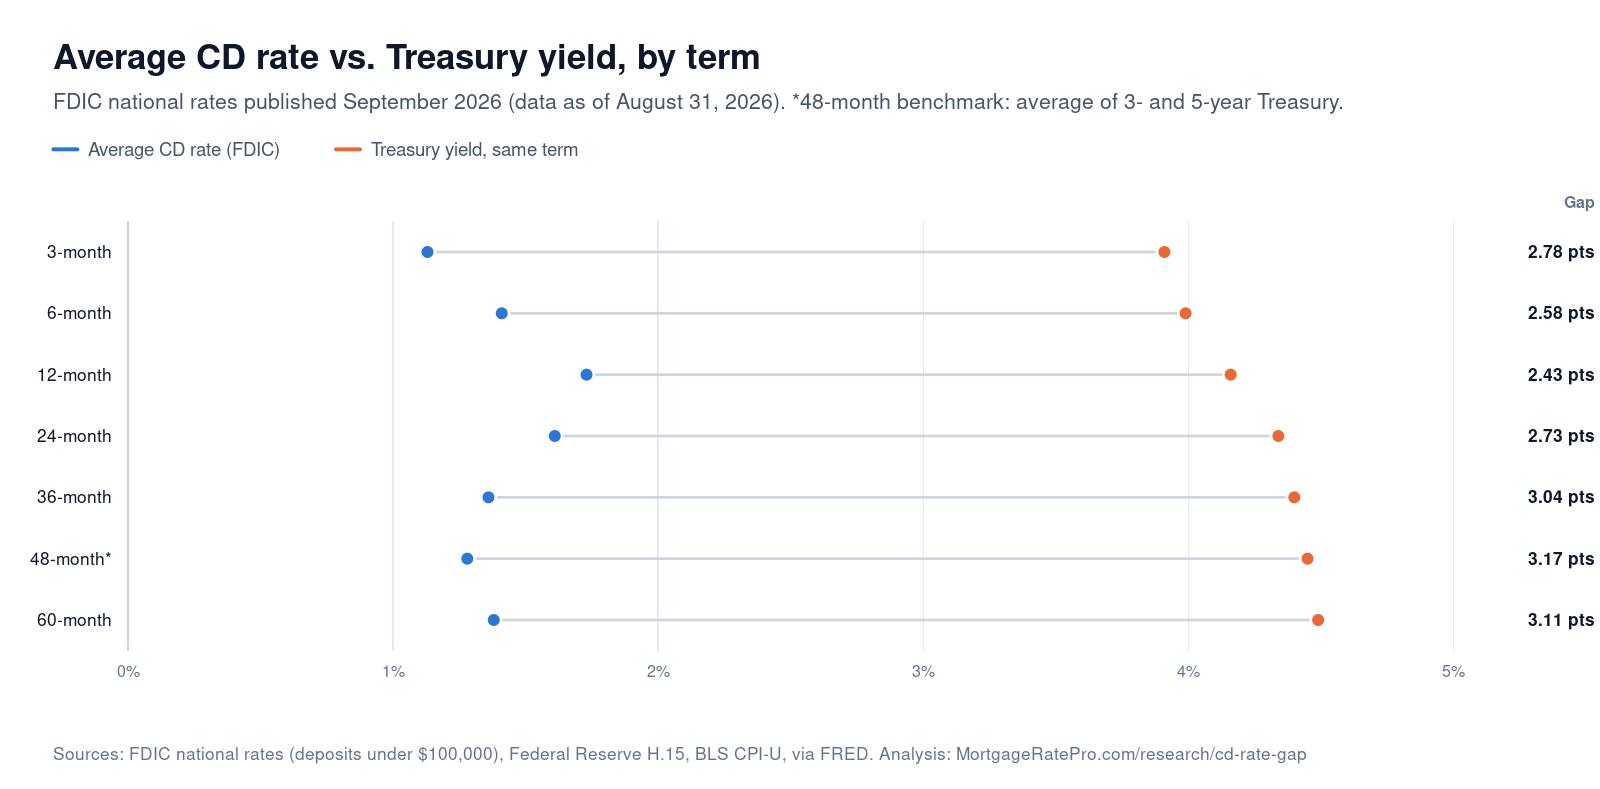
- Locking money up longer pays less, not more. The average 60-month CD paid 1.38%, less than the average 12-month CD, even though the 5-year Treasury yielded 4.49%. The gap is 2.43 points at 12 months and 3.11 points at 60 months. Over five years, $10,000 earns $710 in the average 5-year CD and $2,456 at the 5-year Treasury yield.
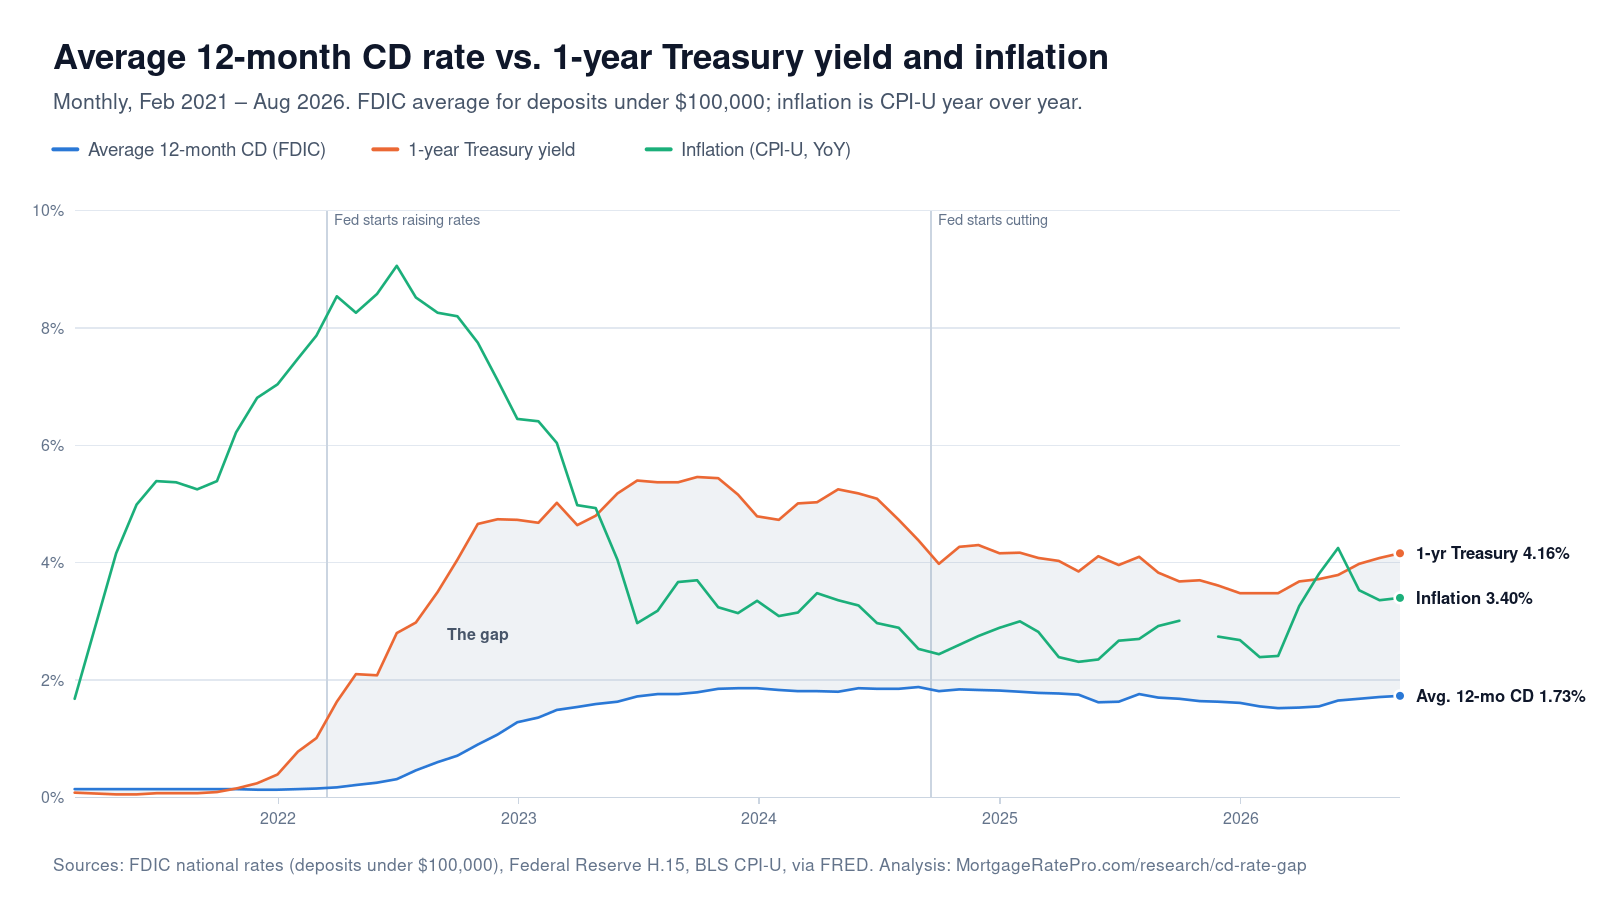
- The average CD hasn't beaten inflation since this data series began. In all 65 monthly readings since February 2021, the average 12-month CD rate was below the annual inflation rate. In August 2026, inflation was 3.40%, which puts the average CD's real return at −1.67 points.
- CD rates barely followed the Fed, in either direction. From February 2022 to the CD rate's peak in August 2024, the Fed raised its target rate by 5.25 points while the average 12-month CD rose 1.73 points, about 33 cents per dollar of increases. When the Fed then cut by 1.75 points, the average CD fell 0.27 points by December 2025.
- Savings accounts lag even more. The average savings account paid 0.37%, less than a tenth of the 3.91% yield on a 3-month Treasury bill.
The gap over time
Average 12-month CD rate vs. the 1-year Treasury yield and inflation, Feb 2021 – Aug 2026
View the data table
| Data as of | Avg. 12-month CD | 1-year Treasury | Gap (pts) | Inflation (CPI-U) |
|---|---|---|---|---|
| Aug 31, 2026 | 1.73% | 4.16% | 2.43 | 3.40% |
| Jul 31, 2026 | 1.71% | 4.08% | 2.37 | 3.36% |
| Jun 30, 2026 | 1.68% | 3.98% | 2.30 | 3.53% |
| May 29, 2026 | 1.65% | 3.79% | 2.14 | 4.25% |
| Apr 30, 2026 | 1.55% | 3.72% | 2.17 | 3.81% |
| Mar 31, 2026 | 1.53% | 3.68% | 2.15 | 3.26% |
| Feb 27, 2026 | 1.52% | 3.48% | 1.96 | 2.41% |
| Jan 30, 2026 | 1.55% | 3.48% | 1.93 | 2.39% |
| Dec 31, 2025 | 1.61% | 3.48% | 1.87 | 2.68% |
| Nov 28, 2025 | 1.63% | 3.61% | 1.98 | 2.74% |
| Oct 31, 2025 | 1.64% | 3.70% | 2.06 | n/a |
| Sep 30, 2025 | 1.68% | 3.68% | 2.00 | 3.01% |
| Aug 29, 2025 | 1.70% | 3.83% | 2.13 | 2.92% |
| Jul 31, 2025 | 1.76% | 4.10% | 2.34 | 2.70% |
| Jun 30, 2025 | 1.63% | 3.96% | 2.33 | 2.67% |
| May 30, 2025 | 1.62% | 4.11% | 2.49 | 2.35% |
| Apr 30, 2025 | 1.75% | 3.85% | 2.10 | 2.31% |
| Mar 31, 2025 | 1.77% | 4.03% | 2.26 | 2.39% |
| Feb 28, 2025 | 1.78% | 4.08% | 2.30 | 2.82% |
| Jan 31, 2025 | 1.80% | 4.17% | 2.37 | 3.00% |
| Dec 31, 2024 | 1.82% | 4.16% | 2.34 | 2.89% |
| Nov 29, 2024 | 1.83% | 4.30% | 2.47 | 2.75% |
| Oct 31, 2024 | 1.84% | 4.27% | 2.43 | 2.60% |
| Sep 30, 2024 | 1.81% | 3.98% | 2.17 | 2.44% |
| Aug 30, 2024 | 1.88% | 4.38% | 2.50 | 2.53% |
| Jul 31, 2024 | 1.85% | 4.73% | 2.88 | 2.89% |
| Jun 28, 2024 | 1.85% | 5.09% | 3.24 | 2.97% |
| May 31, 2024 | 1.86% | 5.18% | 3.32 | 3.27% |
| Apr 30, 2024 | 1.80% | 5.25% | 3.45 | 3.36% |
| Mar 29, 2024 | 1.81% | 5.03% | 3.22 | 3.48% |
| Feb 29, 2024 | 1.81% | 5.01% | 3.20 | 3.15% |
| Jan 31, 2024 | 1.83% | 4.73% | 2.90 | 3.09% |
| Dec 29, 2023 | 1.86% | 4.79% | 2.93 | 3.35% |
| Nov 30, 2023 | 1.86% | 5.16% | 3.30 | 3.14% |
| Oct 31, 2023 | 1.85% | 5.44% | 3.59 | 3.24% |
| Sep 29, 2023 | 1.79% | 5.46% | 3.67 | 3.70% |
| Aug 31, 2023 | 1.76% | 5.37% | 3.61 | 3.67% |
| Jul 31, 2023 | 1.76% | 5.37% | 3.61 | 3.18% |
| Jun 30, 2023 | 1.72% | 5.40% | 3.68 | 2.97% |
| May 31, 2023 | 1.63% | 5.18% | 3.55 | 4.05% |
| Apr 28, 2023 | 1.59% | 4.80% | 3.21 | 4.93% |
| Mar 31, 2023 | 1.54% | 4.64% | 3.10 | 4.98% |
| Feb 28, 2023 | 1.49% | 5.02% | 3.53 | 6.04% |
| Jan 31, 2023 | 1.36% | 4.68% | 3.32 | 6.41% |
| Dec 30, 2022 | 1.28% | 4.73% | 3.45 | 6.45% |
| Nov 30, 2022 | 1.07% | 4.74% | 3.67 | 7.11% |
| Oct 31, 2022 | 0.90% | 4.66% | 3.76 | 7.75% |
| Sep 30, 2022 | 0.71% | 4.05% | 3.34 | 8.20% |
| Aug 31, 2022 | 0.60% | 3.50% | 2.90 | 8.26% |
| Jul 29, 2022 | 0.46% | 2.98% | 2.52 | 8.52% |
| Jun 30, 2022 | 0.31% | 2.80% | 2.49 | 9.06% |
| May 31, 2022 | 0.25% | 2.08% | 1.83 | 8.58% |
| Apr 29, 2022 | 0.21% | 2.10% | 1.89 | 8.26% |
| Mar 31, 2022 | 0.17% | 1.63% | 1.46 | 8.54% |
| Feb 28, 2022 | 0.15% | 1.01% | 0.86 | 7.87% |
| Jan 31, 2022 | 0.14% | 0.78% | 0.64 | 7.48% |
| Dec 31, 2021 | 0.13% | 0.39% | 0.26 | 7.04% |
| Nov 30, 2021 | 0.13% | 0.24% | 0.11 | 6.81% |
| Oct 29, 2021 | 0.14% | 0.15% | 0.01 | 6.22% |
| Sep 30, 2021 | 0.14% | 0.09% | -0.05 | 5.39% |
| Aug 31, 2021 | 0.14% | 0.07% | -0.07 | 5.25% |
| Jul 30, 2021 | 0.14% | 0.07% | -0.07 | 5.37% |
| Jun 30, 2021 | 0.14% | 0.07% | -0.07 | 5.39% |
| May 31, 2021 | 0.14% | 0.05% | -0.09 | 4.99% |
| Apr 30, 2021 | 0.14% | 0.05% | -0.09 | 4.16% |
| Feb 26, 2021 | 0.14% | 0.08% | -0.06 | 1.68% |
The gap by CD term
Average CD rate vs. the Treasury yield for the same term, rates as of August 31, 2026
| CD term | Avg. CD rate | Treasury yield | Gap (pts) | Cents per $1 | Interest on $10,000: CD | Treasury |
|---|---|---|---|---|---|---|
| 3-month | 1.13% | 3.91% | 2.78 | 29¢ | $28 | $96 |
| 6-month | 1.41% | 3.99% | 2.58 | 35¢ | $70 | $198 |
| 12-month | 1.73% | 4.16% | 2.43 | 42¢ | $173 | $416 |
| 24-month | 1.61% | 4.34% | 2.73 | 37¢ | $325 | $887 |
| 36-month | 1.36% | 4.40% | 3.04 | 31¢ | $414 | $1,379 |
| 48-month* | 1.28% | 4.45% | 3.17 | 29¢ | $522 | $1,900 |
| 60-month | 1.38% | 4.49% | 3.11 | 31¢ | $710 | $2,456 |
| Savings account | 0.37% | 3.91% (3-month bill) | 3.54 | 9¢ | Variable rate, no fixed term | |
Interest over the full term on a $10,000 deposit, with both rates compounded once a year.
The Fed just raised rates. Will CD rates follow?
The Federal Reserve's new target range of 3.75%–4.00% took effect on September 17, 2026, a 0.25-point increase and the first since July 2023. The FDIC figures in this edition reflect rates on August 31, 2026, before the move.
History suggests savers at the average bank shouldn't expect much. During the last hiking cycle, the average 12-month CD captured about 33 cents of every dollar of Fed increases. At that pace, this 0.25-point increase would lift the average 12-month CD by roughly 0.08 points: about $8 a year on a $10,000 deposit.
Treasury yields have already moved. The 1-year Treasury yielded 4.45% on September 21, 2026, compared with 4.16% on August 31, 2026.
Next update: the FDIC's next national rates are expected on October 19, 2026. They will be the first to show whether banks raised CD rates after the Fed's move, and this report will be updated the same week.
What this means for savers
- Treat the average as a floor, not a target. CD rates vary widely from one institution to the next. The Treasury yield for the same term, in the table above, is a useful yardstick for any offer.
- Taxes widen the gap for many savers. Interest on Treasury bills and notes is exempt from state and local income taxes; CD interest is not.
- Know the trade-offs. CDs at FDIC-insured banks are protected up to $250,000 per depositor, per bank, per ownership category, and cashing out early usually costs a penalty. Treasuries are backed by the U.S. government and can be bought at TreasuryDirect or through a brokerage; if you sell before maturity, the price can be lower than what you paid.
- Longer isn't automatically better. At the average bank, a longer CD doesn't pay a higher rate. Compare each term on its own.
To see what a specific rate earns on your deposit, use the CD calculator, or go straight to a term: 3-month, 6-month, 1-year, 5-year, jumbo or IRA CD.
Methodology
CD and savings rates. FDIC national rates for deposits under $100,000, published monthly in the FDIC's National Rates and Rate Caps. Since April 2021 the national rate has been the average of rates paid by all insured depository institutions and credit unions with available data, weighted by each institution's share of domestic deposits. Each release reflects rates on the last business day of the previous month: this edition, published in September 2026, reflects rates on August 31, 2026.
Treasury benchmark. Daily constant-maturity yields from the Federal Reserve's H.15 release, taken on the same date as the FDIC data and matched by term: 3- and 6-month bills, and 1-, 2-, 3- and 5-year notes. There is no 4-year Treasury, so the 48-month benchmark is the average of the 3- and 5-year yields.
Calculations. The gap is the Treasury yield minus the average CD rate, in percentage points. "Cents per $1" is the CD rate divided by the Treasury yield. Dollar amounts assume $10,000 held for the full term, with both rates compounded once a year. Treasury yields are quoted on a semiannual (bond-equivalent) basis, so this simplification slightly understates Treasury earnings and the gap.
Inflation. The year-over-year change in the Consumer Price Index for All Urban Consumers (CPI-U, not seasonally adjusted) for the month of the FDIC data. FRED has no CPI value for October 2025, so that month is left out of the inflation comparison.
Pass-through of Fed moves. The change in the average 12-month CD rate divided by the change in the upper bound of the federal funds target range: from February 28, 2022, before the first increase of the 2022–23 cycle, to the CD rate's peak on August 30, 2024, and from that peak to December 31, 2025, after the last cut of the 2024–25 cycle.
Sources. All series were retrieved from FRED, Federal Reserve Bank of St. Louis:
- FDIC National Rates and Rate Caps (via FRED): NDR3MCD, NDR6MCD, NDR12MCD, NDR24MCD, NDR36MCD, NDR48MCD, NDR60MCD
- Treasury constant-maturity yields, Federal Reserve H.15 (via FRED): DGS3MO, DGS6MO, DGS1, DGS2, DGS3, DGS5
- Consumer Price Index for All Urban Consumers, BLS (via FRED): CPIAUCNS
- Federal funds target range, Federal Reserve (via FRED): DFEDTARL, DFEDTARU
Download, cite or embed
The figures and charts on this page may be republished with a credit to MortgageRatePro and a link to this page (CC BY 4.0).
- Rates and gap by CD term (CSV)
- Monthly history since Feb 2021 (CSV)
- Chart, gap over time: PNG · SVG
- Chart, gap by term: PNG · SVG
Suggested citation
MortgageRatePro, “CD Rate Gap Report,” September 2026 edition, https://www.mortgageratepro.com/research/cd-rate-gap/

About this report
This report is written and maintained by Federico Miotti, founder and editor of MortgageRatePro. He holds a Master's in Finance and Management Control and founded Quadra Studio, where he leads the strategic finance practice.
Media inquiries: press@mortgageratepro.com. Custom cuts of the data (by term, by period) are available on request.
Frequently Asked Questions
What is the average CD rate right now?
According to the FDIC's September 2026 national rates, which reflect rates on August 31, 2026, the average 12-month CD pays 1.73%, the average 6-month CD 1.41% and the average 60-month CD 1.38%. These are national averages for deposits under $100,000; the table above lists every term.
Why are average CD rates so much lower than Treasury yields?
Banks set deposit rates according to how much they need to attract or keep deposits, not directly from Treasury yields. Institutions with large, stable deposit bases have little reason to raise rates quickly, and because the FDIC national rate is weighted by each institution's share of domestic deposits, the largest institutions carry the most weight in the average. Savers who don't compare offers tend to earn close to that average.
Will CD rates go up after the Fed's latest rate increase?
The Fed's new target range of 3.75%–4.00% took effect on September 17, 2026. In the last hiking cycle, the average 12-month CD captured about 33 cents of every dollar of Fed increases. At that pace, a 0.25-point increase would lift the average 12-month CD by roughly 0.08 points, about $8 a year on a $10,000 deposit. The FDIC update expected on October 19, 2026 will be the first to show how banks responded.
Where does this data come from?
CD and savings rates are the FDIC's monthly national rates. Treasury yields are the Federal Reserve's daily constant-maturity series (H.15), inflation is the Bureau of Labor Statistics' CPI-U, and the fed funds target range comes from the Federal Reserve. All series were retrieved from FRED, the data service of the Federal Reserve Bank of St. Louis. The methodology section above explains how they are matched.
Can I use these charts and numbers?
Yes. You can republish the figures and charts with a credit to MortgageRatePro and a link to this page. High-resolution PNG and SVG charts and CSV files are in the download section.